Scenarios & method

Three pathways,
aligned to ENTSO-E TYNDP 2024.

Each pathway maps to the one number that drives your returns — the wholesale price your assets capture. Same transparent engine, only the input pathway changes.

app.powerlens.io · Scenario Comparison
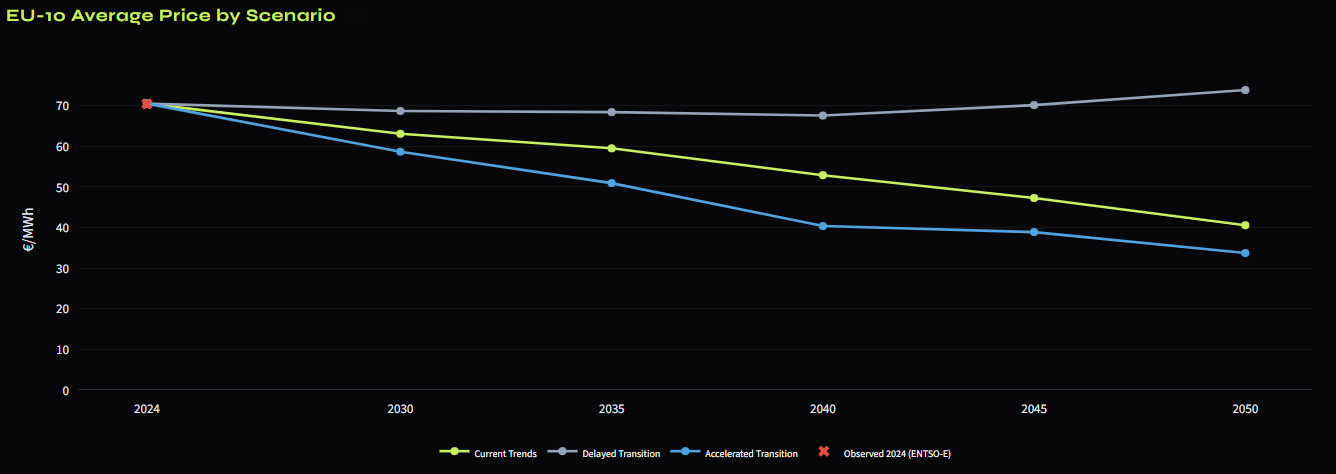
EU-10 average price by scenario to 2050 — Current Trends, Accelerated and Delayed Transition, with observed 2024.
EU-10 average day-ahead price by scenario. The central case moves from ~71 €/MWh (2024) toward ~41 €/MWh by 2050 — a clean bracket around it.
Downside for prices
Accelerated Transition
TYNDP Distributed Energy pathway: aggressive VRE build-out, high BESS deployment and strong carbon pricing. More zero-cost supply pushes wholesale prices down and deepens cannibalisation — the squeeze on capture rates.
2030 EU-10 avg55€/MWh
Base · Reference
Current Trends
The central case: full TYNDP National Trends pathway. Balanced solar and wind growth, moderate storage, gas as the backstop. The defensible baseline most investment cases start from.
2030 EU-10 avg64€/MWh
Upside for prices
Delayed Transition
National Trends with deliberately lower solar/wind rollout and higher fossil dependency. Gas stays on the margin longer, so wholesale prices hold higher — the upside case for merchant revenue.
2030 EU-10 avg66€/MWh

Upside and downside are framed from your point of view — higher wholesale prices help merchant returns, faster clean build-out squeezes them. Tilt the supply build and commodity prices within any scenario — down to individual VRE technologies — or commission a fully custom one.

From historical data to an
hourly price, in four steps.

The same engine runs every scenario. Only the inputs change — and every input is visible.

01 · Calibrate
Anchor to reality

Hourly prices, capacity and demand from ENTSO-E, IRENA, Ember, Eurostat — 2024 hindcast to a 0.1 €/MWh mean error, in sample.

02 · Set assumptions
Every input is a slider

Fuel & CO₂, demand, nuclear, BESS and per-technology VRE — all visible and adjustable.

03 · Dispatch hourly
Clear 8,760 hours

A merit-order LP (PyPSA + HiGHS) clears every hour, per market, per year to 2050 — ~15s/year, cached in under 10.

04 · Quantify risk
Ship a confidence band

Monte-Carlo weather re-draws turn a single curve into a P10–P90 band — every output ships with its interval.

Transparency includes the limitations. The current model tends to under-price gas-heavy markets by ~30 €/MWh in some forward years — stated up front, so sophisticated buyers can weight it themselves. Every assumption is yours to set, and every data source is publicly cited.

Bend a scenario to your thesis,
or commission a custom one.

Run the three pathways yourself, tilt any assumption, or have us scope a bespoke scenario around your asset.